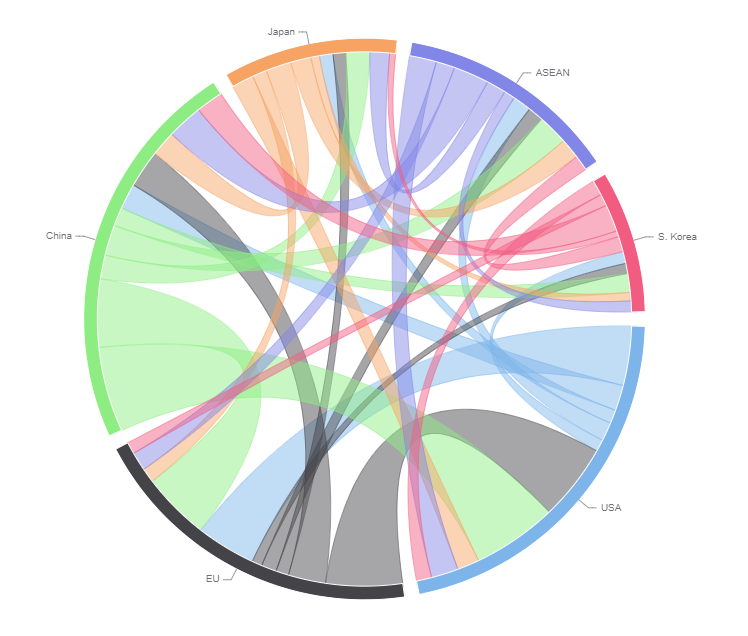
New Data Charts Added Five new charts — Radar Chart, Tree Map, Arc Diagram, Chord Diagram, and Sankey Diagram — are now available for a range of analytical purposes. Patterns that were difficult to express with existing visualizations, such as comparisons, proportions, and flows, can now be shown more intuitively. |