Mapping Hidden Connections in Squid Game Using Knowledge Graphs
This tutorial covers how to input text data into NetMiner 5 and use the Knowledge Graph feature to visualize various people, events, and entities as a network graph. If you're new to knowledge graphs, be sure to check out our introduction: “Hidden Connections in Texts with Knowledge Graphs”
Section 1. Importing Unstructured Data
The analysis data used here is a text excerpt from Netflix's Squid Game Season 1.
In NetMiner, go to File > Import > Unstructured.

Click the Choose File button to select the TXT file to import (multiple selections allowed).
Enter a name for the dataset in the Enter Data Item Name field.
In Choose Target Workspace, select the workspace where the dataset will be saved. If you choose New, a new workspace will be created.
Once the import is complete, a new Tabular dataset (unstructured or loosely structured table data) will be added.


Section 2. Building a Knowledge Graph
As of July 2025, the Knowledge Graph feature is available in the Lab section and utilizes a language model.
※ To use the Knowledge Graph or AI Assistant, you need to configure the language model in advance under Tools > Preferences.For commercial LLMs (such as ChatGPT or Gemini), you’ll need to obtain and register an API key from the service provider to enable these features.
☞ Get API key and Selecting an AI Language Model
A. Knowledge Graph
Go to Lab > Knowledge Graph to launch the feature.
In the Input section of the control panel on the right, select the text column you want to analyze.


In the Main Process section, check Choose Node Types, then select Person. Click Run Process to begin the analysis. If you skip checking this option, the system will extract a broader range of entity types in a more flexible format.


Once the analysis is complete, you can view the extracted Nodes and their connections in the Relations tab.


B. Adding the Results to Your Dataset
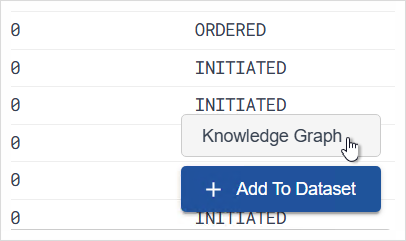
Select either the Nodes or Relations tab, then click Add to Dataset at the bottom to include the analysis results in your dataset.


Section 3. Visualizing the Knowledge Graph
Go to Visualize > Network > 1-mode to open the network visualization window.
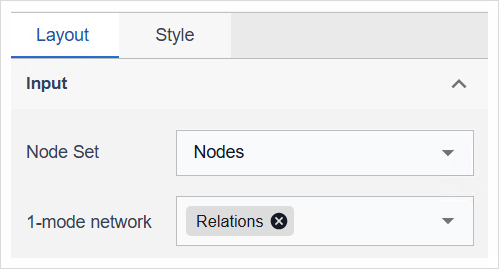
Select the node set and link set generated from the Knowledge Graph, then click Run Process.

In the control panel on the right, click the Style tab.
To adjust Label: Click the icon next to the Label option. Change the Color to black and Position to Center.


Let's display the link types on the network:
In the right control panel, go to the Style tab and then click on the Link sub-tab.
Under Label, click the dropdown and select Type. The type of each link will now appear along the connecting lines. You can also adjust the label’s size, color, and position by clicking the icon next to the Label option.


You’ll now see the visualized relationships extracted from your text data.


Start uncovering new connections and express them beautifully through your own Knowledge Graph!