NetMiner 5 Onboarding Guide: Your First Steps in Network Analysis
This tutorial is designed to help you easily and simply learn the core features of NetMiner 5.
With NetMiner 5, discover the power of hidden relationships in your data through an intuitive interface—no complex coding required.
What will you learn in this tutorial? | |
Who is this tutorial for? |
|
NetMiner 5 features used in this tutorial |
|
Before You Start
The user interface of NetMiner 5 is organized as follows: When you first launch the program, a blank project screen appears. Once you open a dataset from the File menu, all features become available.

Main Menu: Provides access to all functions such as file operations, tools, preprocessing, analysis, and visualization.
Tool Bar: Offers quick access to frequently used features in the form of icons.
Dataset / Process Log: Displays the data currently being used and the analysis steps taken.
Workspaces: Allows you to systematically manage multiple datasets and analysis workflows within a single project.
Output Panel: The area where analysis and visualization results are displayed.
Control Panel: The area for setting analysis options and adjusting visualization results.
Section 1. Converting an Excel File into a Network Map
The sample data represents a work advice network among employees within a company.
(Default sample data path: C:Users(Your Username)NetMiner 5SampleData)
The sample data is structured as follows:
A. Importing Network Data into NetMiner 5
Go to File >> Import >> Structured.

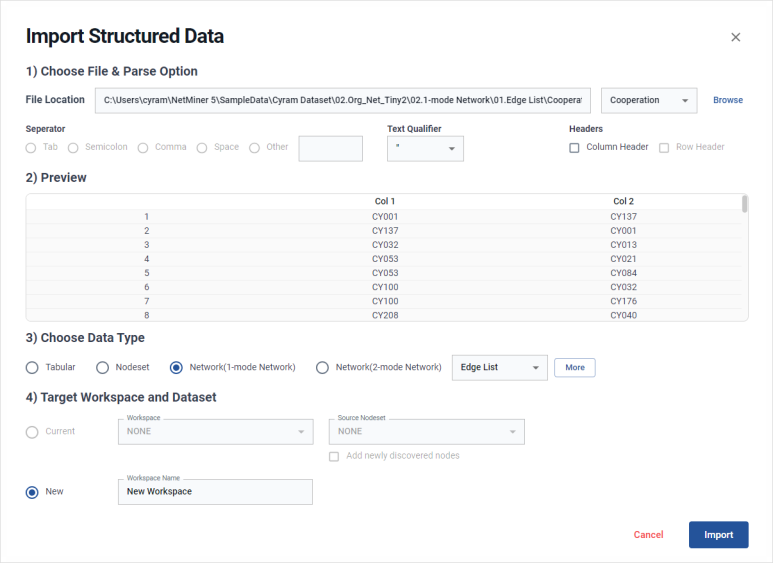
Click the Browse button and select the Excel or CSV file you want to import.
In Choose Data Type, select Network (1-mode Network) and set the data format to Edge List.
In Target Workspace and Dataset, select New, enter a name for the new workspace, and click the Import button.
B. Drawing a Network Map
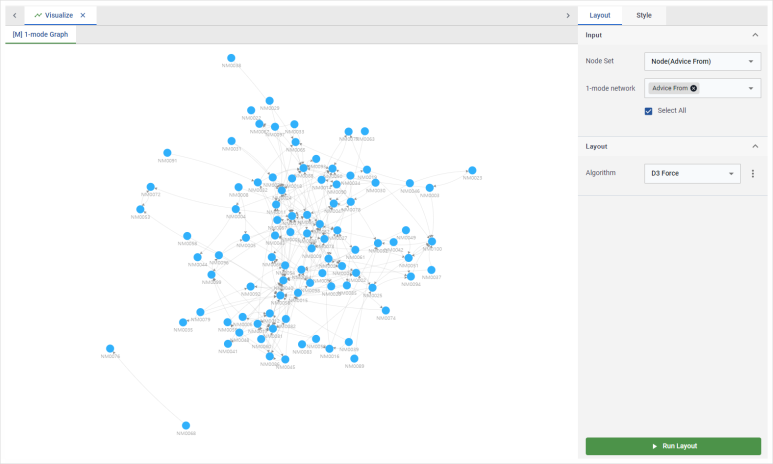
Go to Visualize > Network > 1-mode.
In Control Panel, under Input, select the 1-mode network you just imported.
Under the Layout control section, choose a layout algorithm such as D3 Force, then click the Run Layout button.

Section 2. Highlighting Key Players in the Network
A. Centrality Analysis
Go to Network > Centrality > Degree Centrality.
In Control Panel, select the 1-mode network and click the Run Process button.
B. Adding Analysis Results to Your Dataset
From the result tabs, select [T] Degree Centrality.
At the bottom right of the result table, click Add to Dataset > Node Attribute.

If both In-Degree Centrality and Out-Degree Centrality are selected, then click OK. The centrality values are now added as new attributes to the node set.
C. Visualizing Centrality on the Network Map
Go to Visualize > Network > 1-mode.
In the right-hand Control Panel, click the Style tab.
Adjusting Node Size: Click the size icon next to the Size option. Select the recently added In-Degree Centrality. Nodes with higher centrality will instantly appear larger.

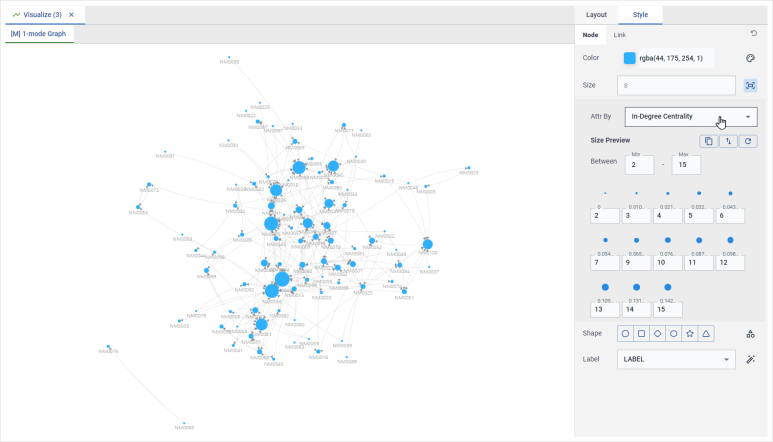
You can also change color, shape, and labels in the same way.
Section 3. Let AI Help You Understand Complex Analysis Results
A. Community Analysis
Go to Network > Cohesion > Community > Louvain.
In the right-hand Control Panel, select the 1-mode network and click the Run Process button.
B. Launching the AI Assistant
※ Before using the AI Assistant, you need to set up the language model under Tools > Preference. For commercial LLMs (e.g., ChatGPT, Gemini), you must obtain and register an API key from the service provider.
☞ Set up the language model in Preferences
☞ How to obtain an API key for a commercial LLM

Click the AI Assistant button at the bottom of the report.
When the chat window appears, you can enter a brief description of the analysis data (e.g., “trust relationships within the organization”) to receive a more accurate interpretation. Or just click 'Generate Response'
You can also change the Answer Language if needed.

Section 4. Turning Text into a Network in One Minute
Sample Data: Three speech files
A. Importing Unstructured Text Files
Go to File > Import > Unstructured.

In the dialog box, click Choose File and select all prepared .txt files.
Set a Data Item Name, then click the Import button.
B. Natural Language Processing / Tokenization
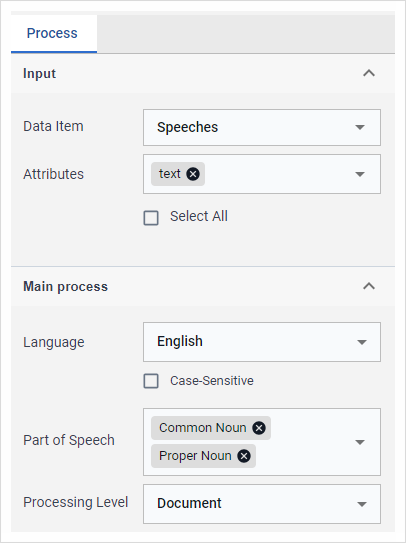
Go to Pre-process > Text > Tokenizer.
In the Input section, select the imported data item and the attribute containing the text.
In Main Process, choose the text language and the part(s) of speech to extract (e.g., English, Common Noun, Proper Noun).
Click the Run Process button to proceed.

C. Visualizing the Document-Word Network
In the result tabs, click [T] Words-Documents Network. This automatically generated network shows which words appear in which documents.
Click Add to Dataset to add the result to your dataset.
Go to Visualize > Multi-mode.
In the right-hand Control Panel, set Two Nodesets to Words and Documents, and select the previously added Words-Documents Network under Multi-mode networks.

You can now visually explore which words appeared in each document, as well as which words are shared across the three speeches.
Section 5. Customizing Theme and Language Preferences
A. Switching to Dark Mode
Look for the Tool Bar at the top of the NetMiner 5 screen.
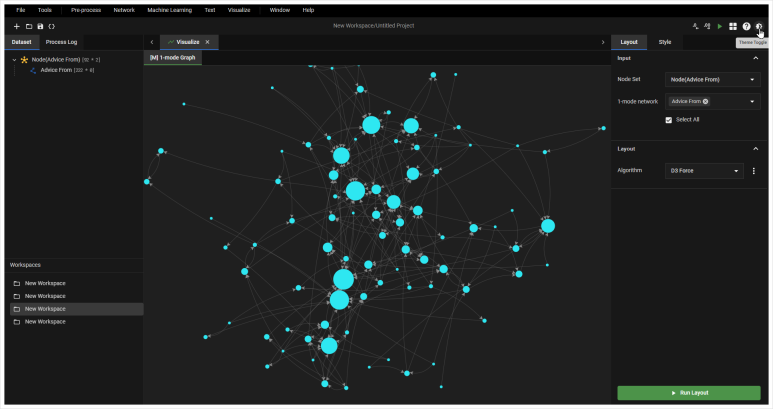
Click the Theme Toggle icon at the top right to instantly switch between dark mode and light mode..

B. Setting Default Visualization Style
Go to Tools > Preference.
From the left menu, click Styling.
Under the Node tab, select Normal Node.
Customize the Color, Size, and Shape to your preferred style. For example, you can set the default node color to orange and the size to 10.
Click the Save button to apply your changes.
You've now completed the basic process of importing data, analyzing, visualizing, and using AI with NetMiner 5. Now it’s time to explore your data from a new perspective—with NetMiner 5!