R&D Strategy: Mapping your innovation ecosystem and fund flows

R&D project and performance data are good resources for understanding the direction and scale of R&D plan and investments by countries, governments, and companies.
In particular, this is a structured data that includes various network models.
so it's useful for R&D planning, R&D evaluation, R&D management, and research trend.
* * *
The National Science & Technology Information Service (NTIS) is a korean national R&D knowledge information portal that provides integrated access to information on national research and development projects.
NTIS data can be broadly categorized into "R&D Project" and "R&D Performance".
Project Information provides various details about companies that lead and participate in national R&D projects.
While Performance Information offers diverse data on research and development outcomes.
By utilizing the diverse information in NTIS data, researchers can model various network relationships.
※ Examples of R&D Data
- Europe’s OpenAIRE (https://www.openaire.eu/)
- Australia’s ARDC (https://codata.org/)
- Japan’s IRDB (https://irdb.nii.ac.jp/en/)
Create a Meta Matrix - Discover hidden Network Relationship
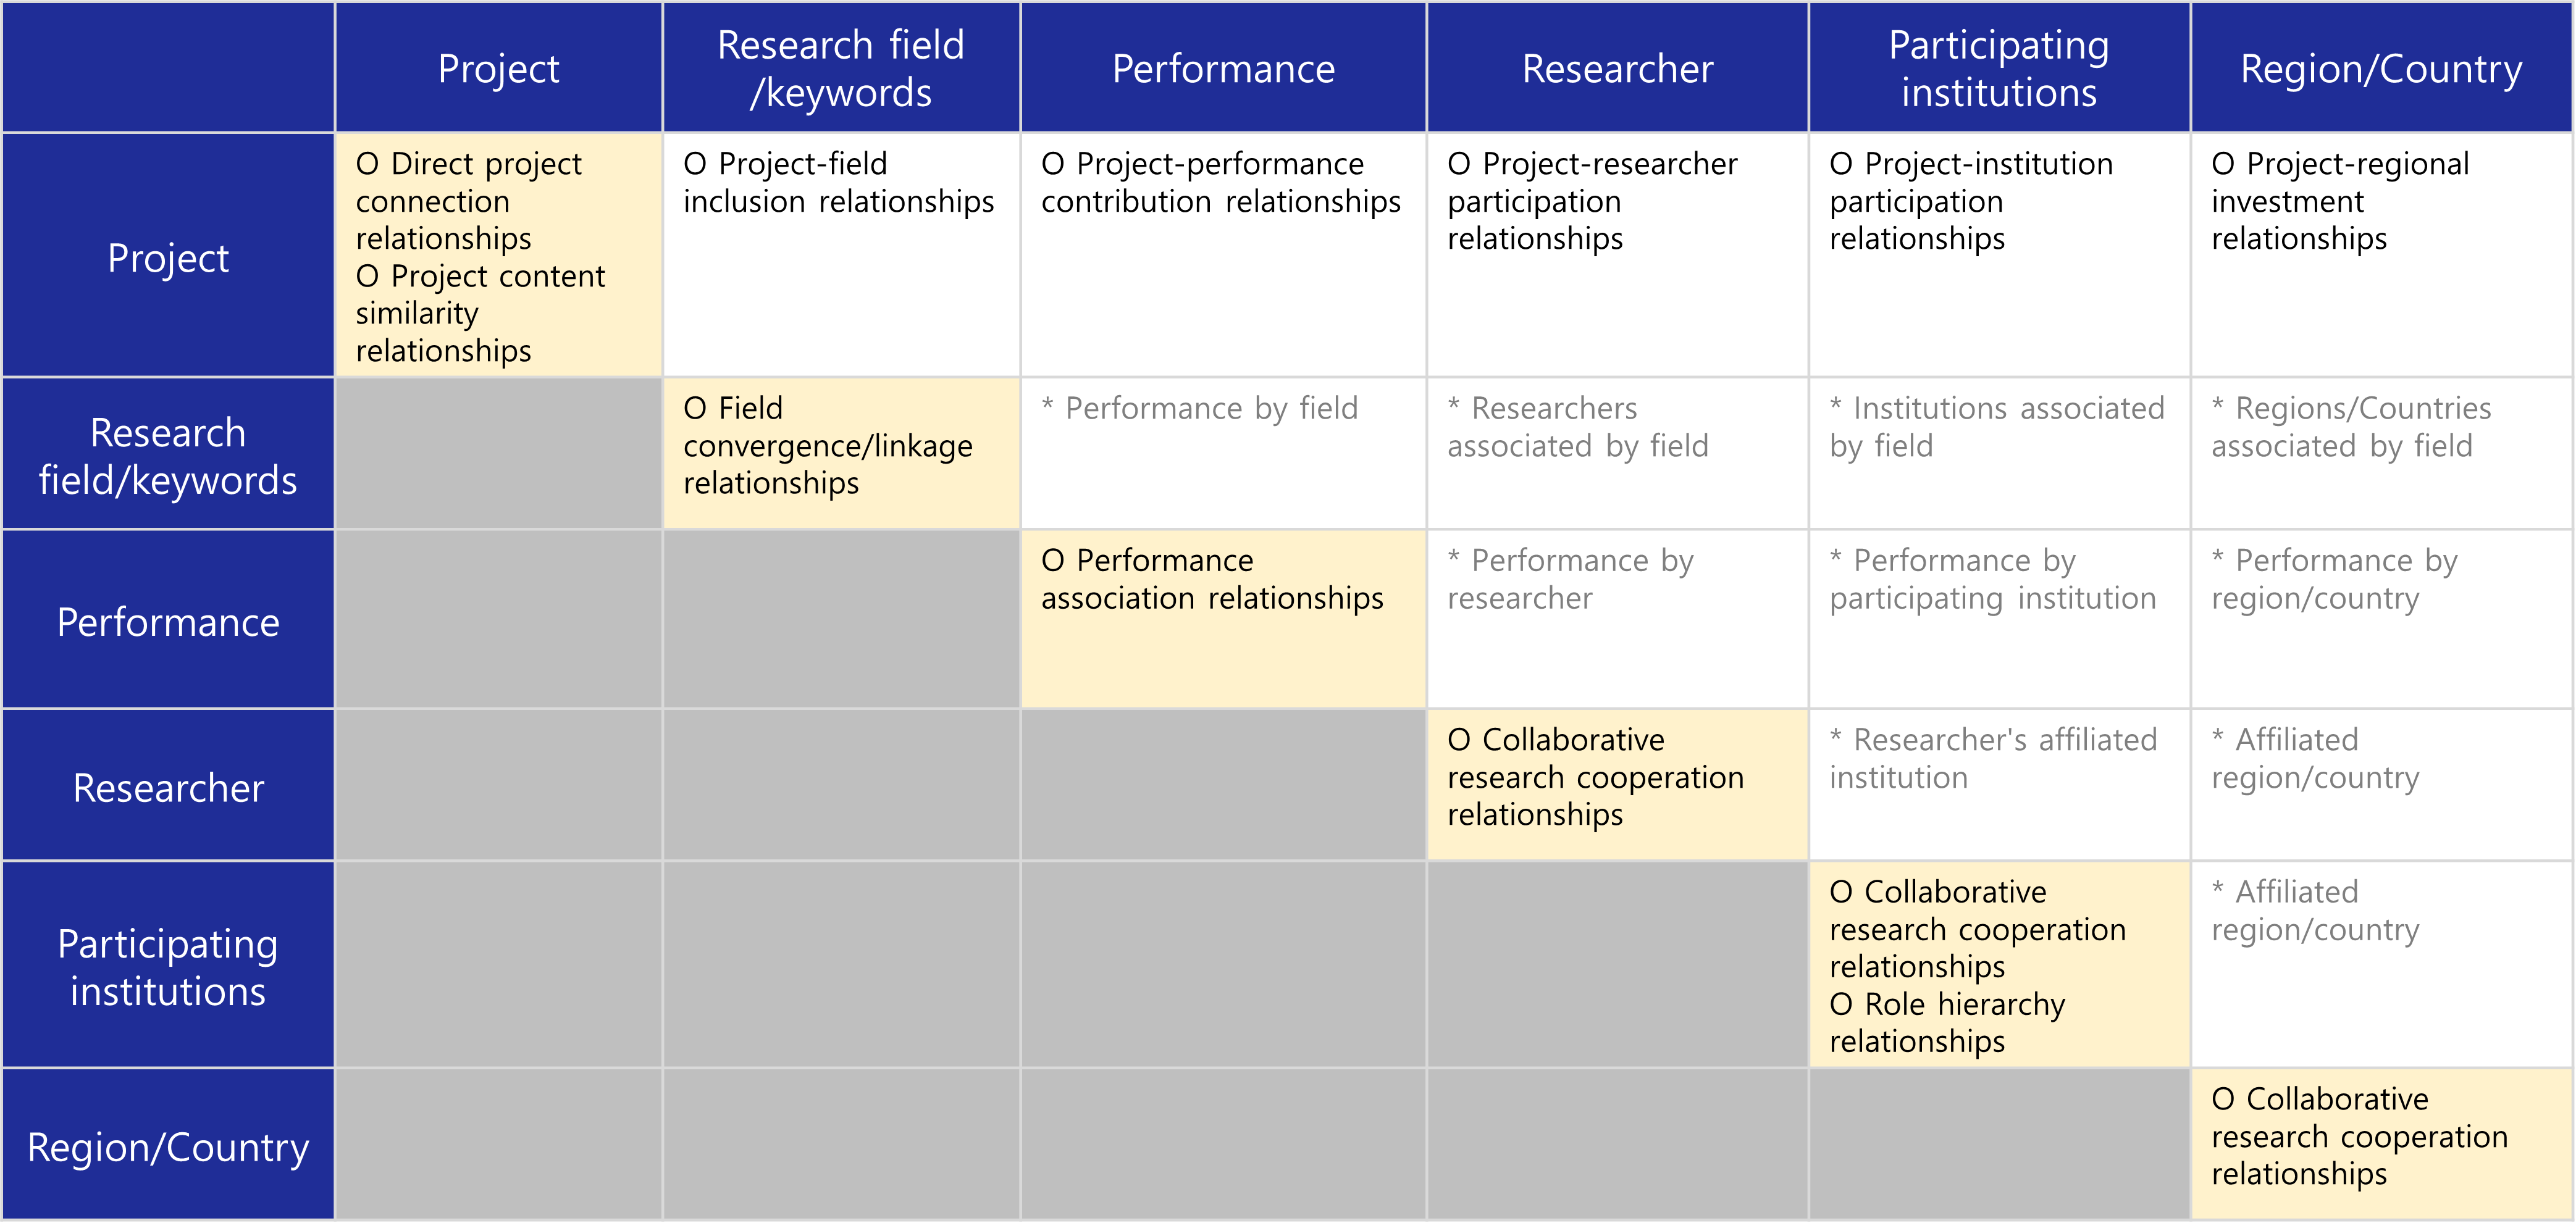
<Meta Matrix>
Here is an example of network modeling using NTIS-provided information with a meta-matrix approach.
Among these, we will take a closer look at project information and the network models that can be generated from it.
Relationships between Participating Institutions
The project information data provides both "project information" and "collaborative/commissioned information".
Researchers can utilize these two types of data to generate two types of networks.
Case 1. Relations between Participating Institutions
First, the "Relationships between Participating Institutions" can be derived. There are two types of relationships between participating institutions.
1. Collaborative research cooperation relationship

<Collaborative research cooperation relationship>
The first type is the "Collaborative research cooperation relationship".
Through this relationship, researchers can analyze the structure and evolving patterns of cooperation between participating institutions.
2. Role hierarchy relationship

<Role hierarchy relationship>
The second type is the "Role hierarchy relationship".
Through this relationship, researchers can analyze the direction of collaboration between participating institutions and the flow of resources.
Case 2. Inter-Regional and International Collaborative Research relationships

<Inter-Regional and International Collaborative Research relationships>
Additionally, "Inter-Regional and International Collaborative Research relationships" can be derived.
This allows for the analysis of "regional cooperation and resource flow structures" as well as "international technology linkage trends".
Create Link Dataset & Import into Netminer
Now, let's explore how to generate a "Lead Institution - Collaborative/Commissioned Institution" link dataset
using project information data from NTIS and how to import the generated
linkset data into NetMiner.
Lead Institution - Collaborative/Commissioned Institution" Linkset Data Generation Method


<Project Information & Collaborative/Commissioned Information>
1. Merge the "Commissioned Research Funding" column and the "Collaborative Research Funding" column from the collaborative/commissioned information data to create a new column named "Collaborative/Commissioned Research Funding."
2. Use the VLOOKUP() function based on the "Project Unique ID" column in the collaborative/commissioned information data to retrieve the lead institution name from the project information data.

<Linkset Data>
How to import the "Lead Institution - Collaborative/Commissioned Institution" Linkset data into NetMiner.
1. File > Import > Excel File

2. Data Type > Click the 1-mode Network button

3. Click the More button, then select the Source-Target columns, choose directionality and weight. Set the weight to the newly created "Collaborative/Commissioned Research Funding" column.

Analysis Result
First of all, you can find the most important researcher/institution/country in the collaborative network using 'Centrality'
Also, 'Community' helps you to recognize the clusters in the R&D ecosystem.
In this article, let's see the visualization of collaborative network.
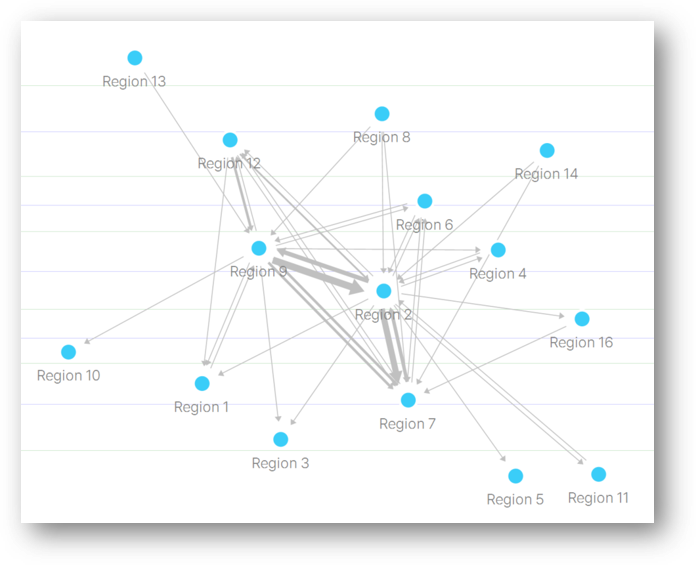
<Inter-regional collaboration relationships>
This is the network visualization of the block modeling analysis results using the "Region" attribute.
Region 2, Region 9, and Region 7 form a strong cluster, and it can be observed that research funding is also being shared within this cluster.
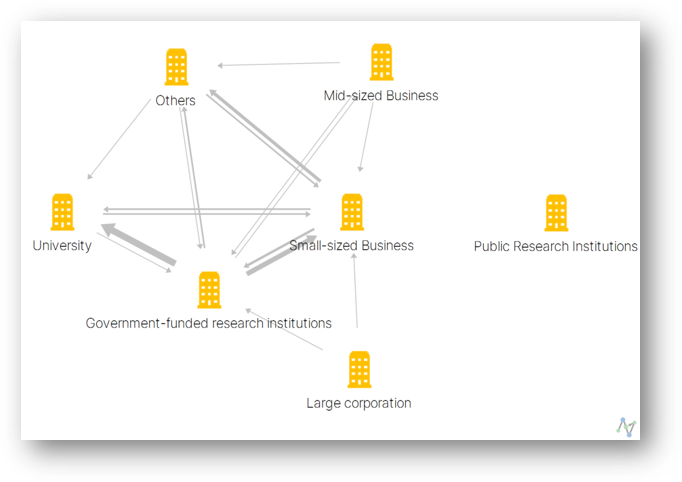
<Collaboration relationships among research-performing entities>
This is the network visualization of the block modeling analysis results using the "Research Performing Entity".
It has been observed that government-funded research institutions serve as lead institutions, leading to collaboration with universities and small and medium-sized enterprises (SMEs).
As a result, research funding is also distributed from government-funded research institutions to universities and SMEs.
So far, we've shared how to make the collaborative network from R&D data, import into NetMiner, and analyze it.
Thank you :)