[NetMiner] China's Economic Changes in the Global Trade Network and Its Relationship with Korea
Following the U.S.-China trade war, warnings are sounding for China's economy due to the impact of COVID-19 originating from China.
The global trade trend is also concerning. Many media outlets report that Korea is expected to suffer the most damage.
This is because Korea is geographically close to China and has a highly integrated economic relationship with it.
But is that really the case?
International trade is a web of exchanges between multiple countries, interconnected through a production value chain.
Therefore, it is difficult to make definitive statements without first examining the overall structure.
This time, let's examine the structural implications of the 2018 global trade network.
To do this, we used the 2018 export-import data of 240 countries provided by the Korea International Trade Association (K-stat // stat.kita.net), similar to the 2015 analysis. We then constructed a 240×240 matrix and analyzed it once again using NetMiner.
The 2018 country-specific GDP data was referenced from the World Bank (data.worldbank.org).
Global Trade Network Map
In the 2015 analysis, we observed that while over 240 countries engage in trade, the network structure naturally divides them into core and peripheral countries.
Three years later, the same core-periphery pattern persists. To focus on an intuitive understanding of the overall structure rather than detailing the analytical process, we have
visualized several network maps (Spring Maps)
First, here is the 2018 <network map (Spring Map) of countries that imported over $12 billion(an average of $1 billion per month)>.
This threshold was set to maintain consistency with the 2015 analysis, where we analyzed countries with an average monthly import of at least $1 billion.
We utilized the "Spring 2D Kamada & Kawai" function in NetMiner for visualization.
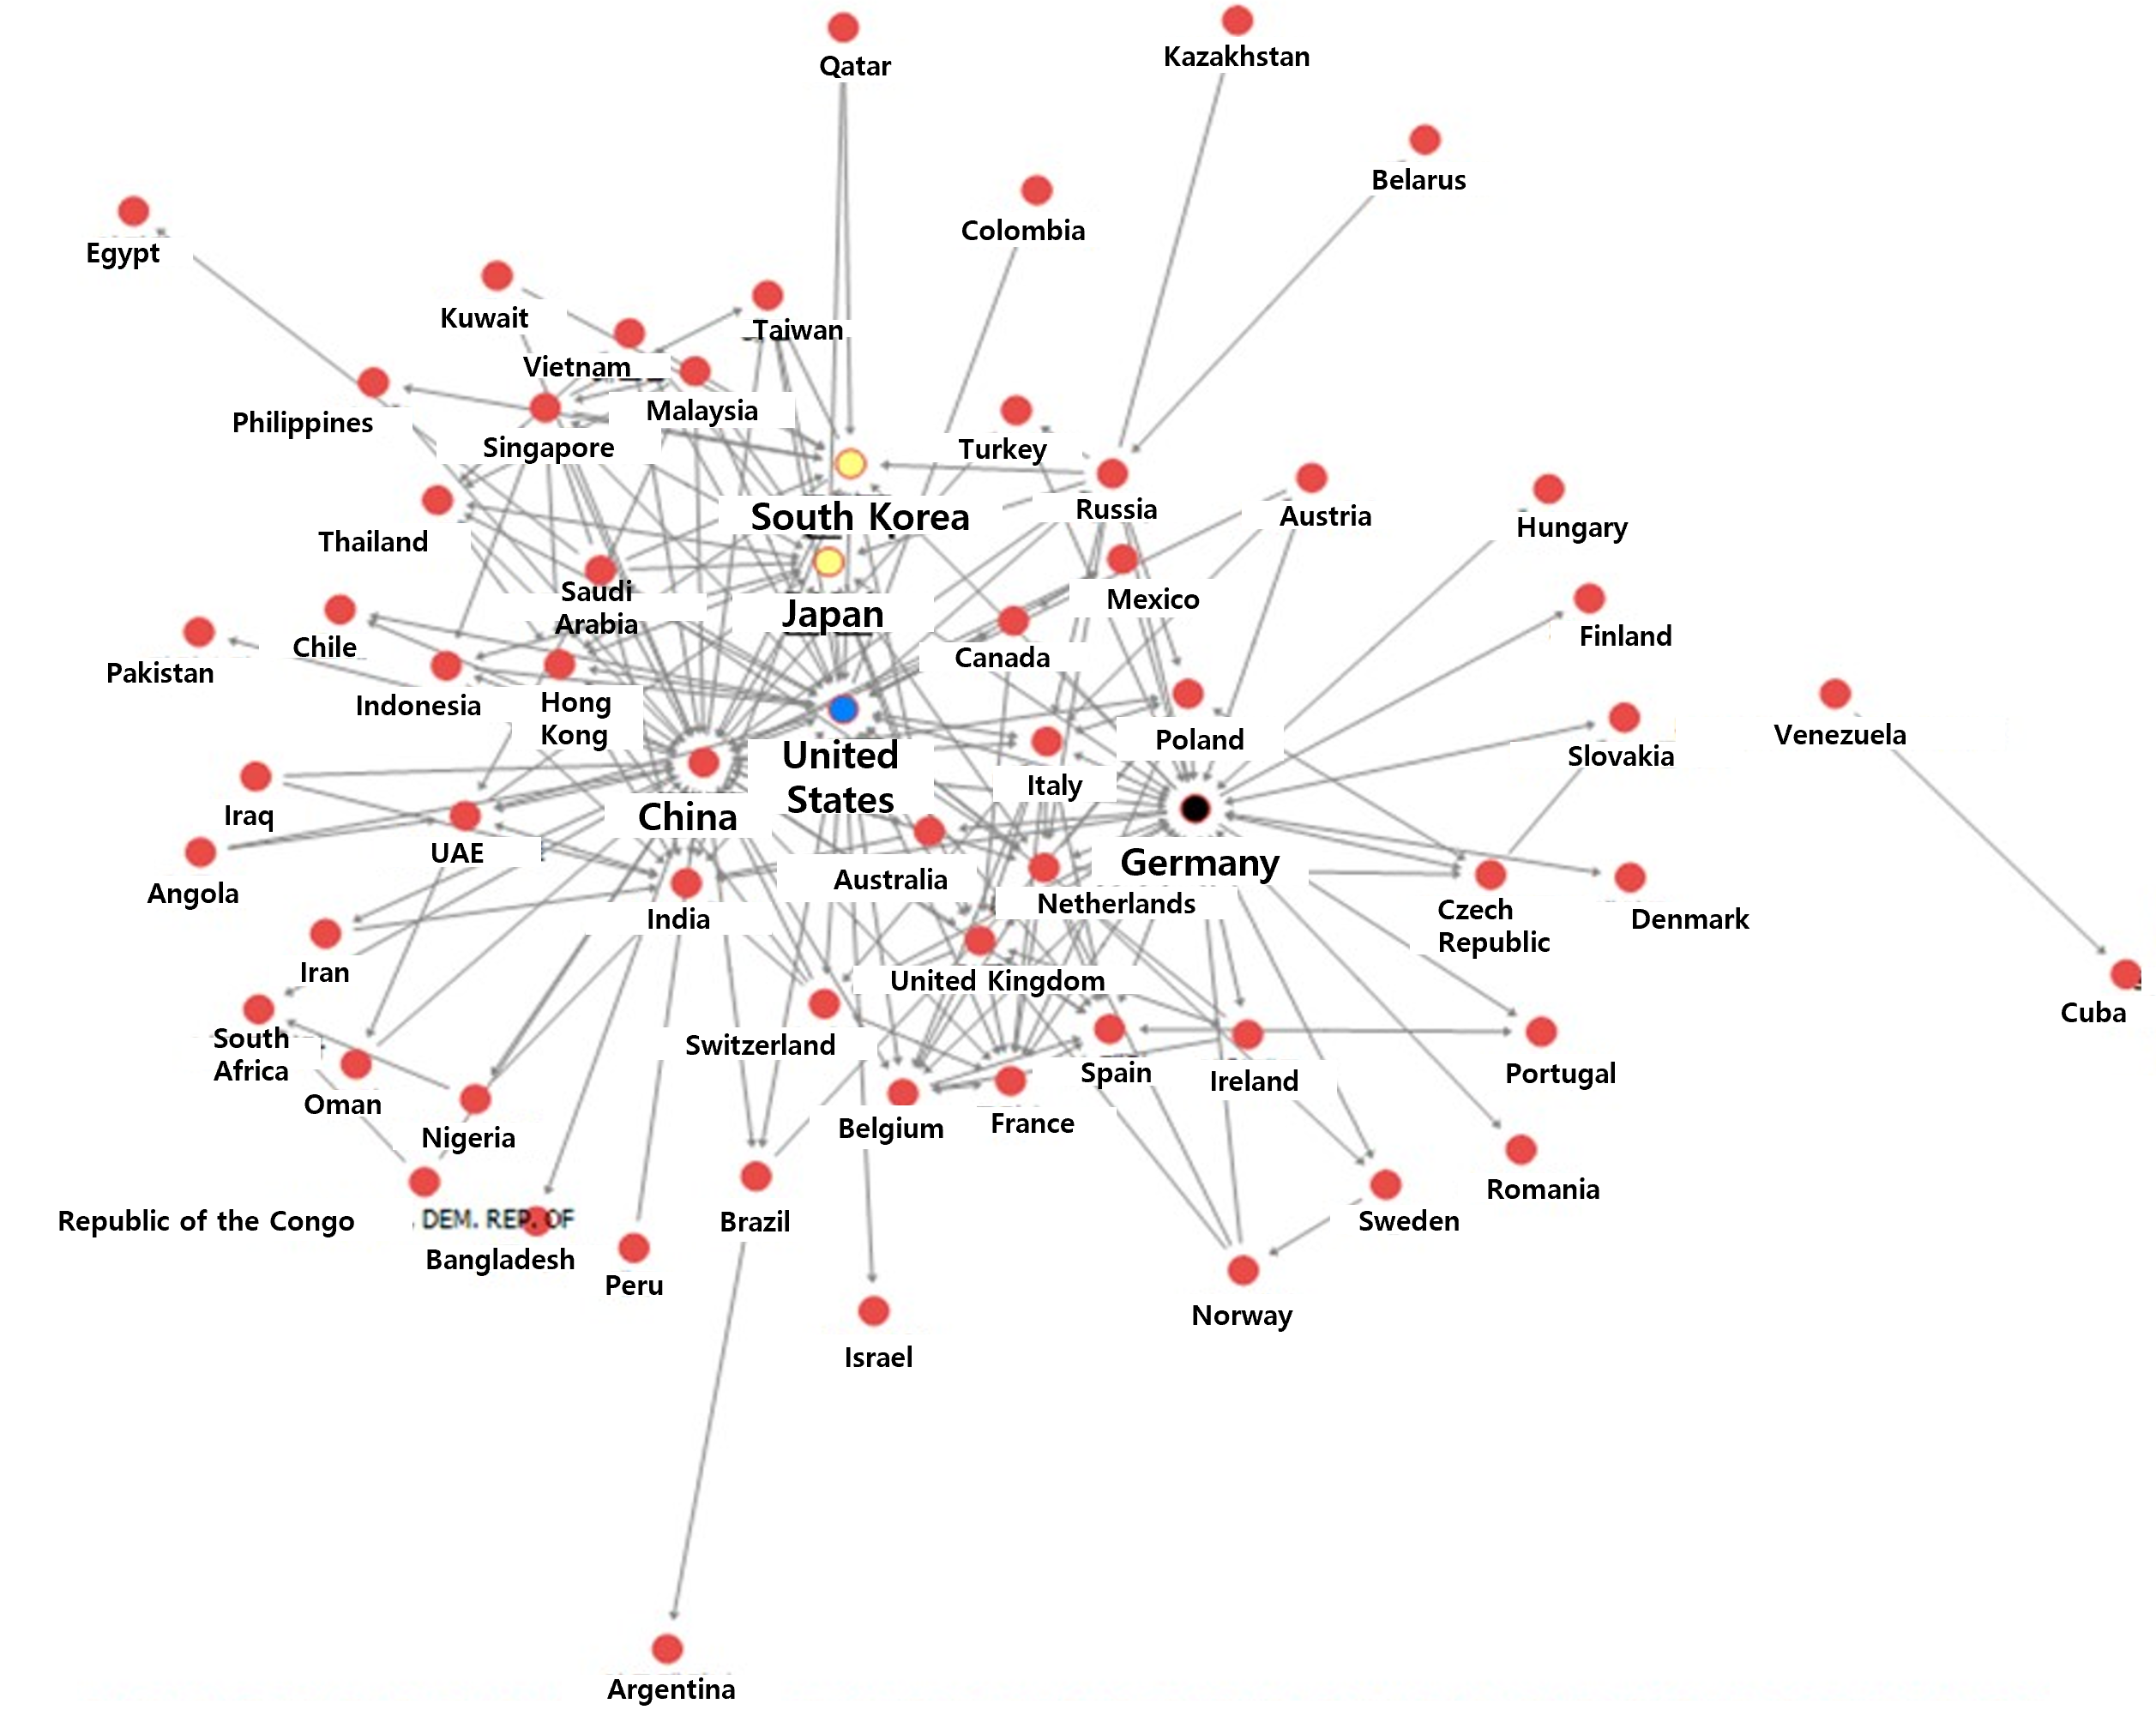
A total of 61 countries form the core of the network, interconnected with one another.
In the 2015 analysis, 53 countries formed the core of the network, but by 2018, this number had slightly increased.
Similarly, we can observe that these core countries are divided into several economic regions.
(1) The East Asian bloc, centered around Korea, Japan, the United States, and China, (2) The European bloc, centered around Germany.
A notable difference from the 2015 analysis is that China has established stronger trade connections with several Middle Eastern and Afican countries,
making this shift more apparent in the 2018 network.
Here is a breif look at the top 10 exporting and importing countries in 2018:
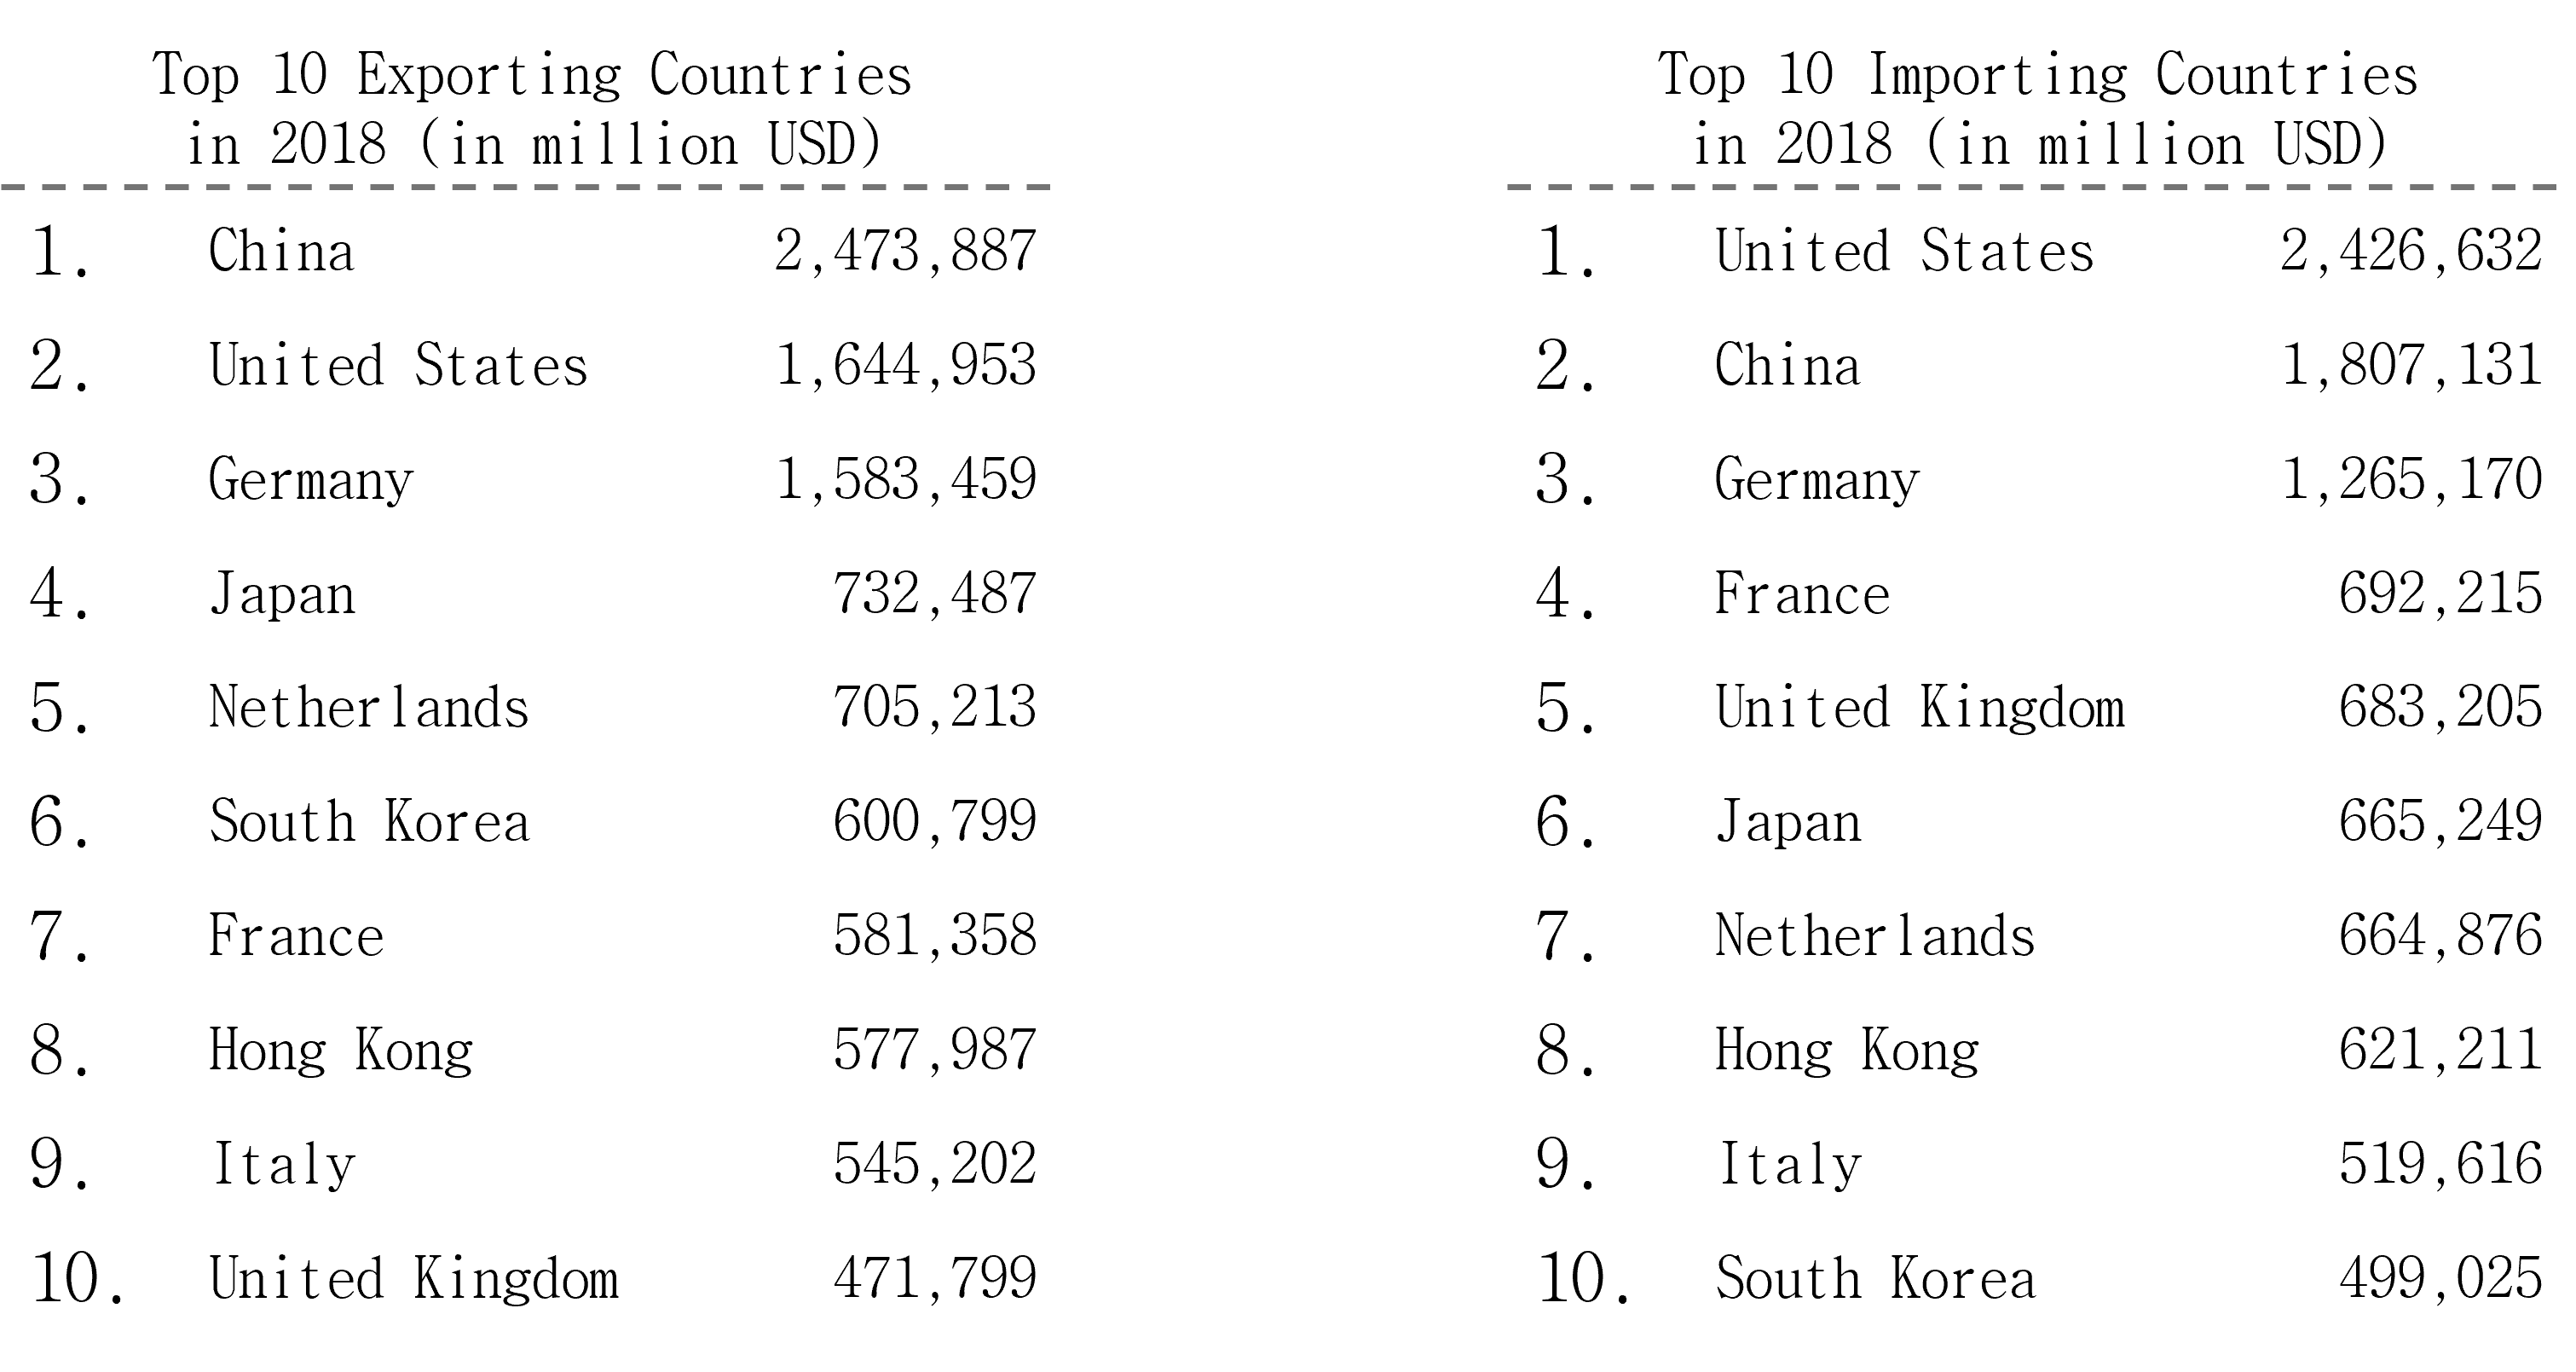
Comparing both lists, we can see that China, Germany, South Korea, and Japan export siginificantly more than they import.
In other words, these four countries have production capacities exceeding domestic consumption, allowing them to generate revenue by selling goods and services to other nations.
(Trade Surplus: China $666 billion, Germany $318 billion, South Korea $101 billion, Japan $67 billion – Total surplus of these four countries: $1,152 billion)
However, when we sum up the trade deficits of the United States, United Kingdom, and France, the total amounts to $1,105 billion.
This accounts for 96% of the total trade surplus ($1,152 billion) of China, Germany, South Korea, and Japan, highlighting the significant trade imbalance between these economies.
This suggests that the United States, United Kingdom, and France consume more than they produce domestically, covering the shortfall by borrowing to import goods
from China, Germany, South Korea, and Japan. Of course, there may be other contributing factors to this trade imbalance as well.
In any case, the America First policy in the U.S., Brexit in the UK, and Macron’s reforms in France all reflect structural imbalances in the global trade network, highlighting the economic pressures that have shaped these developments as of 2020.
This time, we will analyze the relationships among key trading nations by setting the import threshold at $48 billion or more, which is four times the previous threshold.
By adjusting the Link threshold in NetMiner, we can easily generate the following network map.

A total of 25 countries appear in this network map, providing a much clearer picture of the global trade structure compared to the previous 61-country network map.
This refined view allows for a more focused analysis of the core trade relationships.
The United States maintains strong trade ties with Canada and Mexico, reinforcing its dominance in North America - a structure reminiscent of the 1823 Monroe Doctrine.
Similarly, Germany is closely connected with Austria, the Czech Republic, and Poland, evoking the historical concept of Lebensraum (Living Space) or the Greater German Economic Sphere
from the 1930s and 1940s.
Based on these findings, further analysis was conducted on global trade clusters, ego networks and value chains of major countries, and structural holes to assess dominance and bargaining power in the trade network.
For more details, please visit the CYRAM Tistory blog linked below.
China's Economic Fluctuations in the Global Trade Network and Its Relationship with Korea >>