What If 40 Years of Frailty Research Could Be Mapped?
The global elderly population is growing fast — and so is the research on frailty. Since 2000, the number of academic publications on frailty has surged dramatically. But what topics do all these studies share? And how has the field evolved over time?
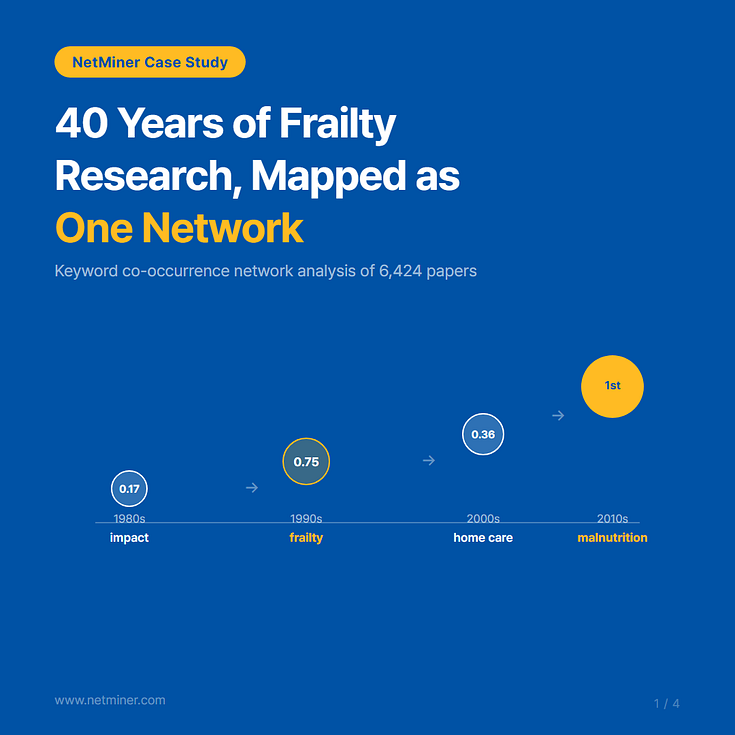
Kim and Jang (2018) visualized the keywords from 6,424 frailty-related journal articles published between 1981 and 2016 using text network analysis, revealing how the knowledge structure of frailty research has shifted across four decades (Kim & Jang, 2018).
Background
What individual papers cannot show
Frailty has long been a central concern in geriatric medicine. Recognized as a key predictor of adverse outcomes — falls, hospitalizations, dependence on long-term care — it became a serious subject of study starting in the 1980s. But as the literature grew, a problem emerged: “frailty” was being defined and measured in different ways by different researchers, making it hard to see where the field had come from and where it was heading.
Systematic reviews and meta-analyses are effective for digging deep into specific questions, but they are not well-suited to capturing the full sweep of thousands of studies at once. They require researchers to read and classify papers one by one, limiting their scope, and they struggle to reveal the structural relationships between topics. There was a need for a method that could show — all at once — what trajectory the field had taken, which topics were currently generating the most discussion, and where future research should go.