Where Is the Latest AI Research Headed? Analyzing Key Researchers from 1,000 International Papers
Want to grasp research trends quickly?
This tutorial walks you through the process of collecting bibliographic data using the Biblio Data Collector and analyzing key authors and research trends with NetMiner 5.
No complex coding required — from data collection to analysis and visualization, it's all in one streamlined workflow.
By following this tutorial, anyone can easily learn the core features and generate meaningful analytical results.
With just NetMiner 5 and the Biblio Data Collector, data-driven research analysis is no longer a challenge.
Section 1. Collecting International Research Bibliographic Data
In this section, we guide you through how to collect bibliographic data using NetMiner 5’s Biblio Data Collector and import it into NetMiner 5 to generate a visual network map.
NetMiner 5 is designed to streamline the data preparation stage, making it efficient and user-friendly.
A. Collecting Bibliographic Data Using Data Collector
Go to Extension >> Biblio Data Collector

With just a few clicks, the Biblio Data Collector allows you to collect research paper data from sources such as Springer, KCI, and OpenAlex.
Collect 1,000 papers related to ‘Artificial Intelligence’ from OpenAlex.
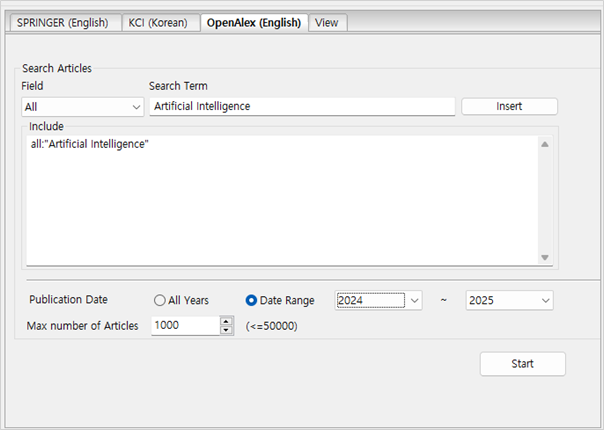
First, click the OpenAlex tab on the right panel.
Field: Choose the search field based on which bibliographic elements you want to filter. If you want to collect data where the keyword appears in the title, select “Title.” Selecting “All” will search across titles, abstracts, keywords, authors, journal names, and organizations.
Search Term: Enter the keyword you want to search for in the selected bibliographic field. In this case, type ‘Artificial Intelligence’ and click the Insert button.
Publication Date: You can choose to collect data from All Years or limit the range using Date Range. For example, if you select Date Range and set it to 2024–2025, only papers published within those years will be collected.
Max number of Articles: Specify how many articles to collect. OpenAlex allows you to retrieve up to 50,000 records at once.
B. Importing Data into NetMiner 5
Double-click the collected dataset from the left panel to view the results in the View tab.
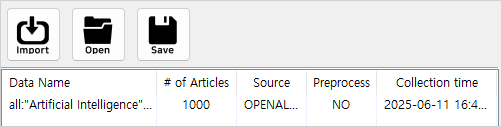
The result panel displays the following information from the collected data.
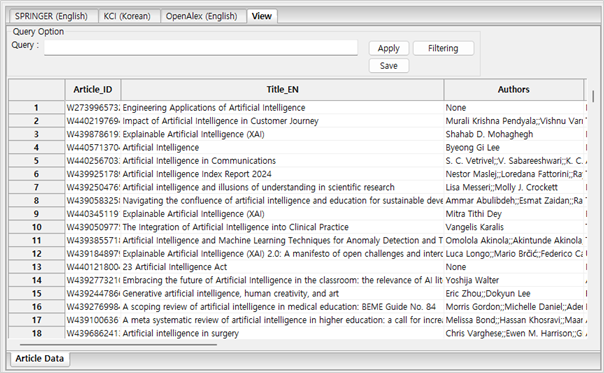
Article ID: A unique identifier for the article. For KCI, the ID managed by KCI is used, while for Springer, the DOI is used.
Title: The title of the article. If both Korean and English versions are available, they are labeled as KR and EN, respectively.
Authors: A list of the article’s authors, separated by commas (,).
Abstract: The abstract of the article. If available in both Korean and English, they are labeled as KR and EN, respectively.
Keywords: Author-provided keywords for the article, separated by commas (,).
Journal:The name of the journal in which the article was published.
Publisher: The organization that published the article
PubDate: The publication date
Citation_Count: The number of citations. This is displayed only for sources that provide citation data (e.g., KCI, OpenAlex). Springer does not provide citation information.
Datasets marked as “NO” under Preprocess cannot be imported into NetMiner 5. You must run the preprocessing step before importing.
Once preprocessing is complete, click "Import into NetMiner" to load the data into NetMiner 5.
The final bibliographic data imported into NetMiner 5 will appear as shown below.

Nodeset: You can view Authors (basic information about authors), Articles (bibliographic information of articles), and Words (words extracted from text) as nodesets.
Network: Through the Authors–Articles Network (relationships between authors and articles) and Words–Articles Network (relationships between words and articles), you can analyze authors and research content (keywords). The Words–Authors Network (relationships between words and authors) allows you to examine the connection between authors and the words they used in their papers.
C. Instantly Create a Co-authorship Network
Once the data has been imported into NetMiner 5, it only takes a few clicks to transform it into a co-authorship network.
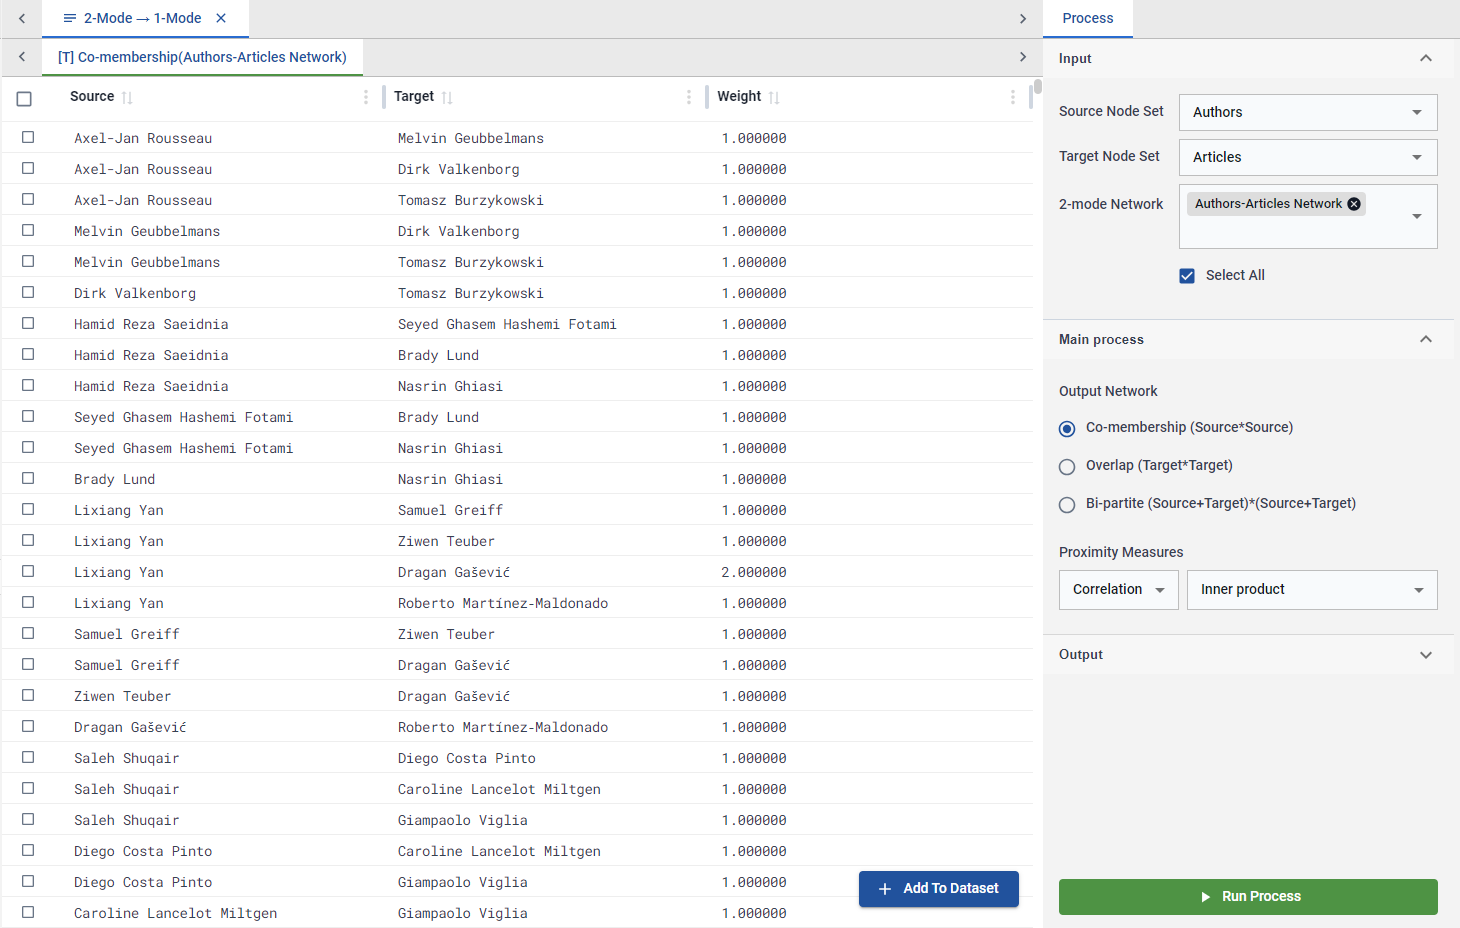
Go to Pre-process > Network Transform > 2-mode → 1-mode.
In the Control Panel on the right side of the screen, select the nodeset and the 1-mode network under the Input tab.
Source Node Set: Select 'Authors' Nodeset
Target Node Set: Select 'Articles' Nodeset
2-mode Network: Select 'Authors-Articles Network'
Select Co-membership (Source * Source) in Main Process, set Correlation – Inner Product in Proximity Measures, and then click the Run Process button.
Section 2. Quickly Identify Key Authors
A. Centrality Analysis
Go to Network > Centrality > Degree Centrality.
In the Input control panel on the right, select the 1-mode network, then click the Run Process button.
B. Add the Analysis Results to Your Dataset
In the Results tab, select [T]Degree Centrality.
At the bottom right of the result table, click Add to Dataset > Node Attribute.
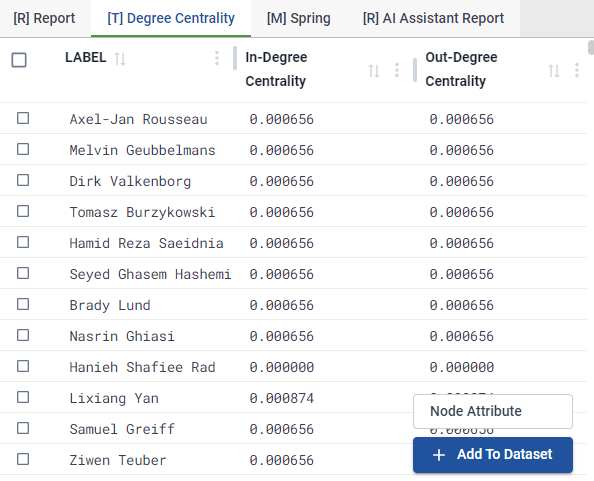
- Make sure both In-Degree Centrality and Out-Degree Centrality are selected, then click OK. The centrality values are now added as new attributes to the nodeset.
C. Visualize Centrality in the Network
Go to Visualize > Network > 1-mode.
In the control panel on the right, click the Style tab.
Adjust Size: Click the size icon next to the Size field, and select the recently added In-Degree Centrality. You will see that nodes with higher centrality values immediately appear larger.
This allows you to visually identify the connections and influence of each author — authors with higher centrality appear larger, while those with lower centrality appear smaller.
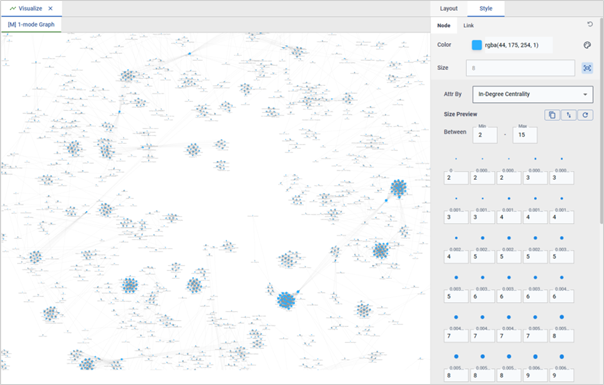
In the same way, you can also adjust color, shape, and label styles.
Section 3. What Are the Key Keywords in AI Articles?
A. Checking Word Frequency and TF-IDF Values
Go to Text > Word Statistics.
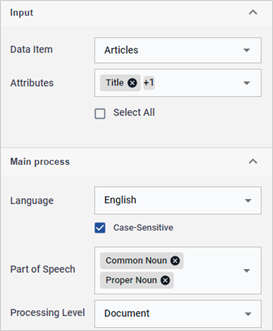
In the Input control items, select the recently imported dataset and the attribute that contains text.
In Main Process, select the language of the text and the part of speech to extract (e.g., English, Common Noun, Proper Noun).
Click the Run Process button to execute the analysis.
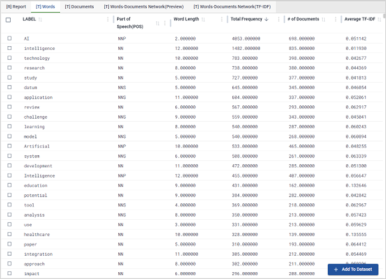
In the [T]Words tab, click the Total Frequency or Average TF-IDF column to sort the values in descending or ascending order.
Total Frequency |
Average TF-IDF |
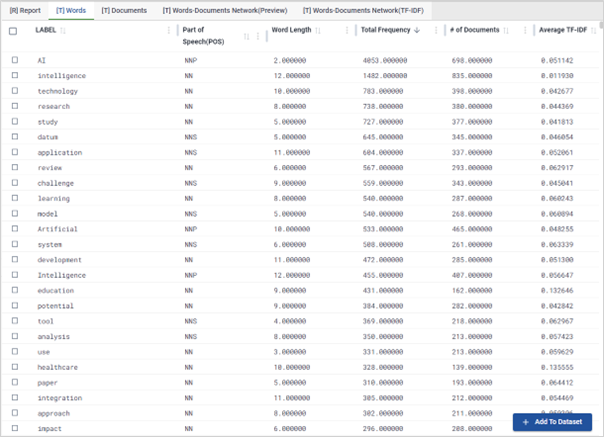
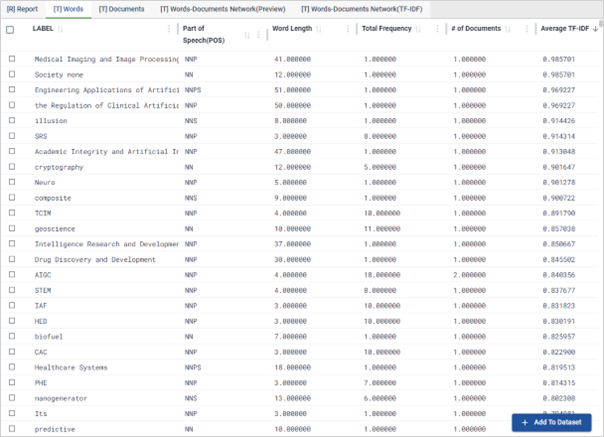
After analyzing 1,000 articles related to Artificial Intelligence, the most frequently used words included 'technology', 'application', 'challenge', 'education', 'potential', 'healthcare' and 'management'.
On the other hand, based on average TF-IDF values, the most significant words were 'Medical Imaging and Image Processing', 'Society', 'Engineering Applications of Artificial
Intelligence', 'the Regulation of Clinical Artificial Intelligence', 'illusion', 'SRS', 'crytography', 'Neuro' and 'geoscience'.
Section 4. Which researchers stand at the center of the AI research network identified by AI?
A. Calling the AI Assistant
※ Before using the AI Assistant, you must configure the language model in Tools > Preference. Commercial LLMs (ChatGPT, Gemini) require an API key obtained from the service provider and registered in NetMiner 5.
☞ Set the language model in Preference
☞ Obtain an API key for a commercial LLM
We will use the Degree Centrality analysis results from Section 2 as an example.
Click the AI Assistant button at the bottom of the report.
※ If the Degree Centrality analysis session is closed, reopen it by clicking the session in the Process Log on the left side of the screen.
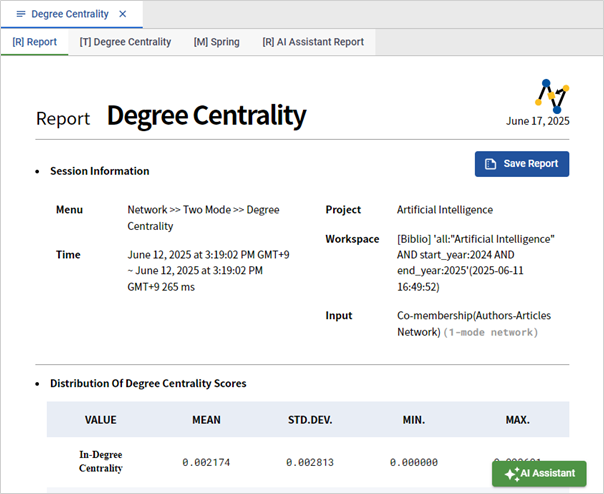
When the dialog appears, you can enter a brief description of the analysis data (e.g., “co-authorship network data”) to guide a more accurate interpretation, or simply click Generate Response without additional input.
Change the Answer Language if necessary.
B.Reviewing the AI-generated report
After a short moment, an AI Assistant Report tab appears in the results panel, displaying the AI-generated interpretation.
The AI Assistant Report is typically divided into two parts:
Data Info: A summary of the analysis data provided to the AI (user description, selected node attributes, and so on).
Interpretation of Result: A narrative explanation produced by the language model based on the analysis results (for example, the significance of nodes with high degree centrality).
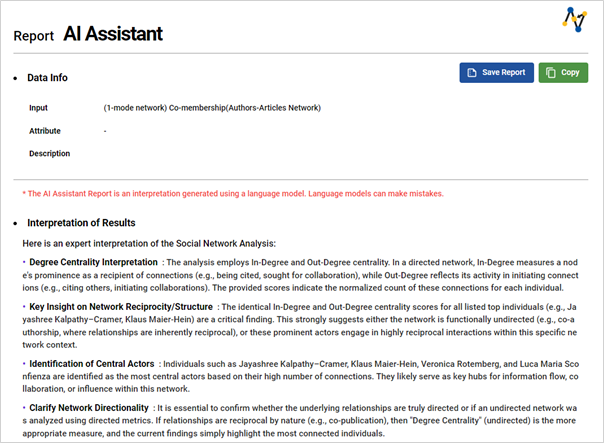
From the AI Assistant’s interpretation,
Jayashree Kalpathy-Cramer (United States, radiology) and Klaus Maier-Hein (Germany, computer science) show the highest degree centrality, indicating that they are key collaborators with the broadest co-author networks. The AI interprets them as highly active hubs.
Authors with high centrality are spread across several countries—including the United States, Germany, and Italy—and span multiple research fields such as radiology, computer science, and dermatology, suggesting strong international and multidisciplinary collaboration. The AI particularly highlights the prominent activity of researchers in radiology.
The AI also recommends additional analyses, such as betweenness centrality or community detection, for deeper insight.
The AI Assistant acts as a bridge between users and the often complex, numerical results of network analysis. It is especially helpful for beginners who may not be familiar with analytical terminology or metrics, as it assists in understanding what the results actually mean.By providing an initial interpretation in response to the fundamental question, “What does this analysis result imply?”, the AI helps reduce users' apprehension and enables deeper exploration of the data.
Even for experienced users, the AI Assistant serves as a valuable tool by offering quick summaries and highlighting key findings, ultimately reducing the time needed for interpretation.
With NetMiner 5 and the Biblio Data Collector, you've completed the process of collecting, analyzing, visualizing bibliographic data, and interpreting results using AI to explore research trends.
Now it's your turn — discover new insights by analyzing your own data with NetMiner 5!